Using Serverless Config to Deploy an AWS CloudWatch Dashboard
[My team’s most recent project has been really interesting - it’s a JavaScript project that includes using the Serverless Framework to deploy a variety of AWS Lambda Functions (e.g. uploading to S3 buckets and making requests to the API that we built). Part of my responsibility as QA Engineer was to set up a CloudWatch dashboard in AWS. Dashboards can be created manually in the CloudWatch service, but I wanted to create the dashboards through code deploys.
Prior to this project, I had zero experience working with AWS, so I was really excited to dig in and get started. I spent a few days this week going through documentation and writing the code, and I successfully deployed my dashboard on Thursday! I also added an alarm for one of the metrics, and created a separate monitoring board through LogicMonitor. I had a lot of fun getting this work done! I want to share some of the technical documentation pitfalls that I came across, how I got past them, and in general how to set up the configuration for deploying an AWS CloudWatch dashboard through code.
Getting Started with Documentation
I started with the documentation for AWS Resource Types, specifically the AWS::CloudWatch::Dashboard section. It gives both JSON and YAML examples (as does most of the documentation), but the YAML really only takes you so far, as you’ll see in a bit. I started with the YAML, since that’s what our Serverless config uses - plus YAML is just so nice to write (I always end up losing track of curly braces in JSON!). That got me to the very tiny beginnings of my config:
Type: "AWS::CloudWatch::Dashboard"
  Properties:
    DashboardName: String
    DashboardBody: String
From there, the docs took me to template snippets for the CloudWatch Dashboard, where I realized that I need a line ahead of what I already had. Here’s your first tip: The line above the Type property can be whatever you want. I didn’t really have any YAML experience before this, so perhaps that’s more well-known, but I started with their naming example in my code. The docs also don’t mention the naming standards for the DashboardName property, but take note that it doesn’t accept spaces (which I only found this out after trying my first deploy). I ended up with:
DashboardSideBySide
  Type: "AWS::CloudWatch::Dashboard"
    Properties:
      DashboardName: Bonanza-Dashboard
      DashboardBody: ’{}’
DashboardSideBySide
The snippet example for DashboardBody is largely unhelpful - it’s such a pain to scroll horizontally through a giant JSON object! It’s basically unreadable in that format. I rummaged around in the documentation some more, and I honestly don’t remember how I found the next useful page. But of course I’ll link to it for you: Dashboard Body Structure & Syntax. This is the real meat of the dashboard config. This was a fairly straightforward copy/fill out scenario, with a couple of exceptions.
Metrics Array
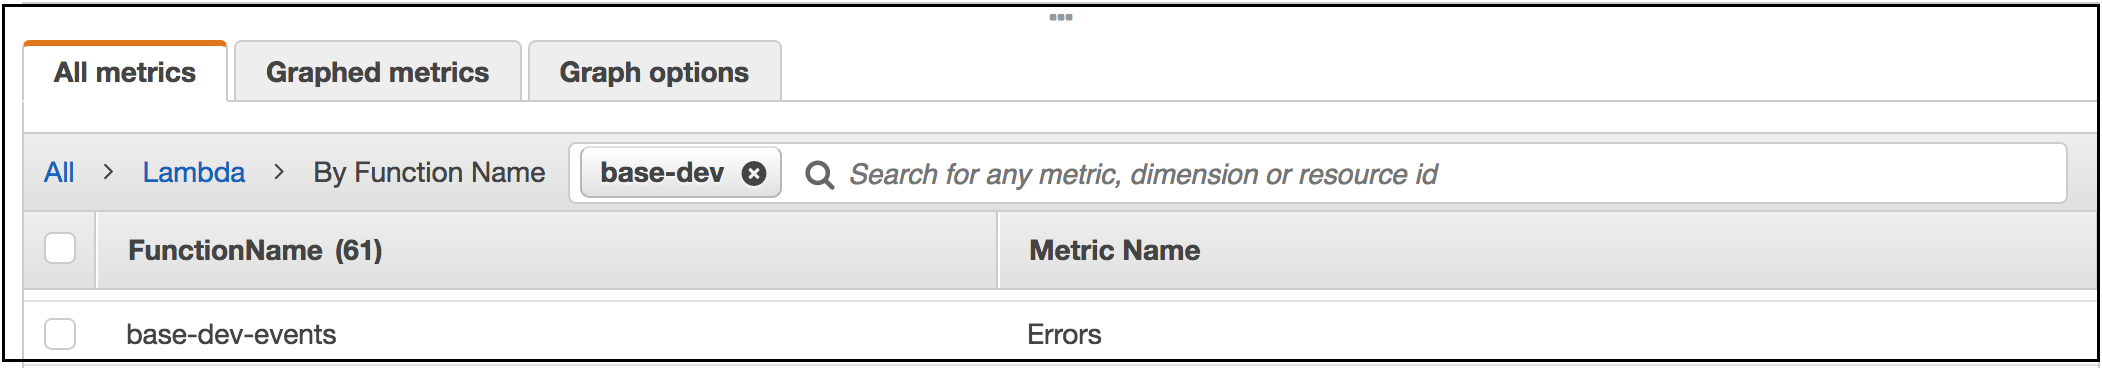
First, the metrics array: Under the section titled “Dashboard Body Object: Metric Widget: Format For Each Metric in the Array”, it gives the format and describes what each of the items are: Namespace, MetricName, DimensionName, DimensionValue. I had already come across the docs for metric dimensions, so I knew that each of our Lambdas have four Dimension Names (Errors, Durations, Throttles, and Invocations), and I used FunctionName for the DimensionValue property. I found the FunctionName by going to CloudWatch > Metrics > Lambdas > By Function Name. So that got me to my MetricName, DimensionName, and DimensionValue values, but what the heck is the Namespace? I couldn’t find it anywhere! Fortunately, I did some random things and managed to notice when I got to a page that had the Namespace listed - and if you have a better way, please leave a comment about it! My steps were: CloudWatch > Metrics > Lambdas > By Function Name to the list of lambdas. The lambdas are listed in a window with three tabs: All Metrics, Graphed Metrics, and Graph Options. Check the box for a metric, and notice the (1) appear in the Graphed Metrics tab. Go over to that tab, and you’ll see a bunch of info about the metric you selected - including the Namespace! I stumbled on this purely by accident - there definitely has to be another way.
So this brought my config to:
DashboardSideBySide:
      Type: AWS::CloudWatch::Dashboard
      Properties:
        DashboardName: "Bonanza-Dashboard"
        DashboardBody:
          '{
            "widgets":[
              {
                "type":"metric",
                "x":0,
                "y":0,
                "Width":12,
                "Height":6,
                "properties":{
                   "metrics":[
                      [
                         "AWS/Lambda",
                         "Errors",
                         "FunctionName",
                         "base-dev-events"
                      ]
                     ],
                     "period":60,
                     "stat":"Sum",
                     "region":"us-west-2",
                     "title":"Events: Errors",
                     "view":"timeSeries",
                     "yAxis":{
                       "left":{
                         "min":0,
                         "max":50
                     }
                   }
                  }
                }
          }'
Documentation Pitfalls
Well, kind of.
That config code snippet is post-pitfall (I promised you there’d be pitfalls!). See that metrics array up there? (The one with the NameSpace, MetricName, and Dimensions that I was talking about in the previous section.) My deploy initially failed with reference about “The dashboard body is invalid; ErrorCode: InvalidParameterInput”, and I just couldn’t figure out where I’d gone wrong. Keith, one of my colleagues, came over to help troubleshoot, and we spent a few puzzling minutes agreeing that it really looked like it should work. Then Keith had a fantastic troubleshooting insight, and we realized that the documentation was using square brackets to indicate an array AND to indicate optional parameters within that same array!
Here’s the documentation:
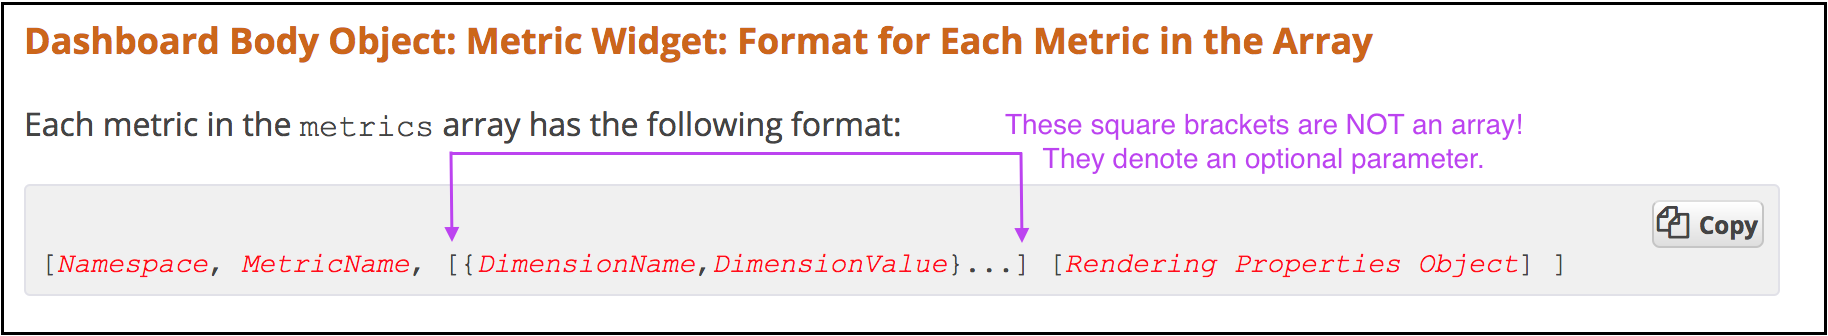
his was such a facepalm moment. Scrolling down to the docs section for each item verified that yes - NameSpace and MetricName were required, whereas DimensionName and DimensionValue were not.
So I adjusted my config to remove those extra square brackets, ran the deploy, and got ready to enjoy looking at my beautiful dashboard.
Well, not quite.
Now the deploy failed with a reference to invalid JSON. Fair enough - I’d been switching some things around, and it’s easy to lose track of curly braces and square brackets, so I ran my code through a linter. Expecting ':', got ','. I took another look at my code, and then at the documentation.

Sure enough, they DID use a comma instead of a colon! {DimensionName,DimensionValue} should be {DimensionName:DimensionValue}. Easy fix, and I’ll be on my way to a successful deploy…
Well, almost.
That took me back to the “dashboard body is invalid” deploy failure. It turns out that the comma is correct. It’s the object syntax that’s wrong! Those curly braces do not belong there at all. I figured it out by just looking at the docs and thinking, “What if the technical writer just made a mistake?” None of the other items on the same level were separated into different objects, so why would these be? So I just took them out and tried a deploy - sure enough, that’s what the blocker was. Please let my pain help you have a better experience - ignore those curly braces.
Final Config
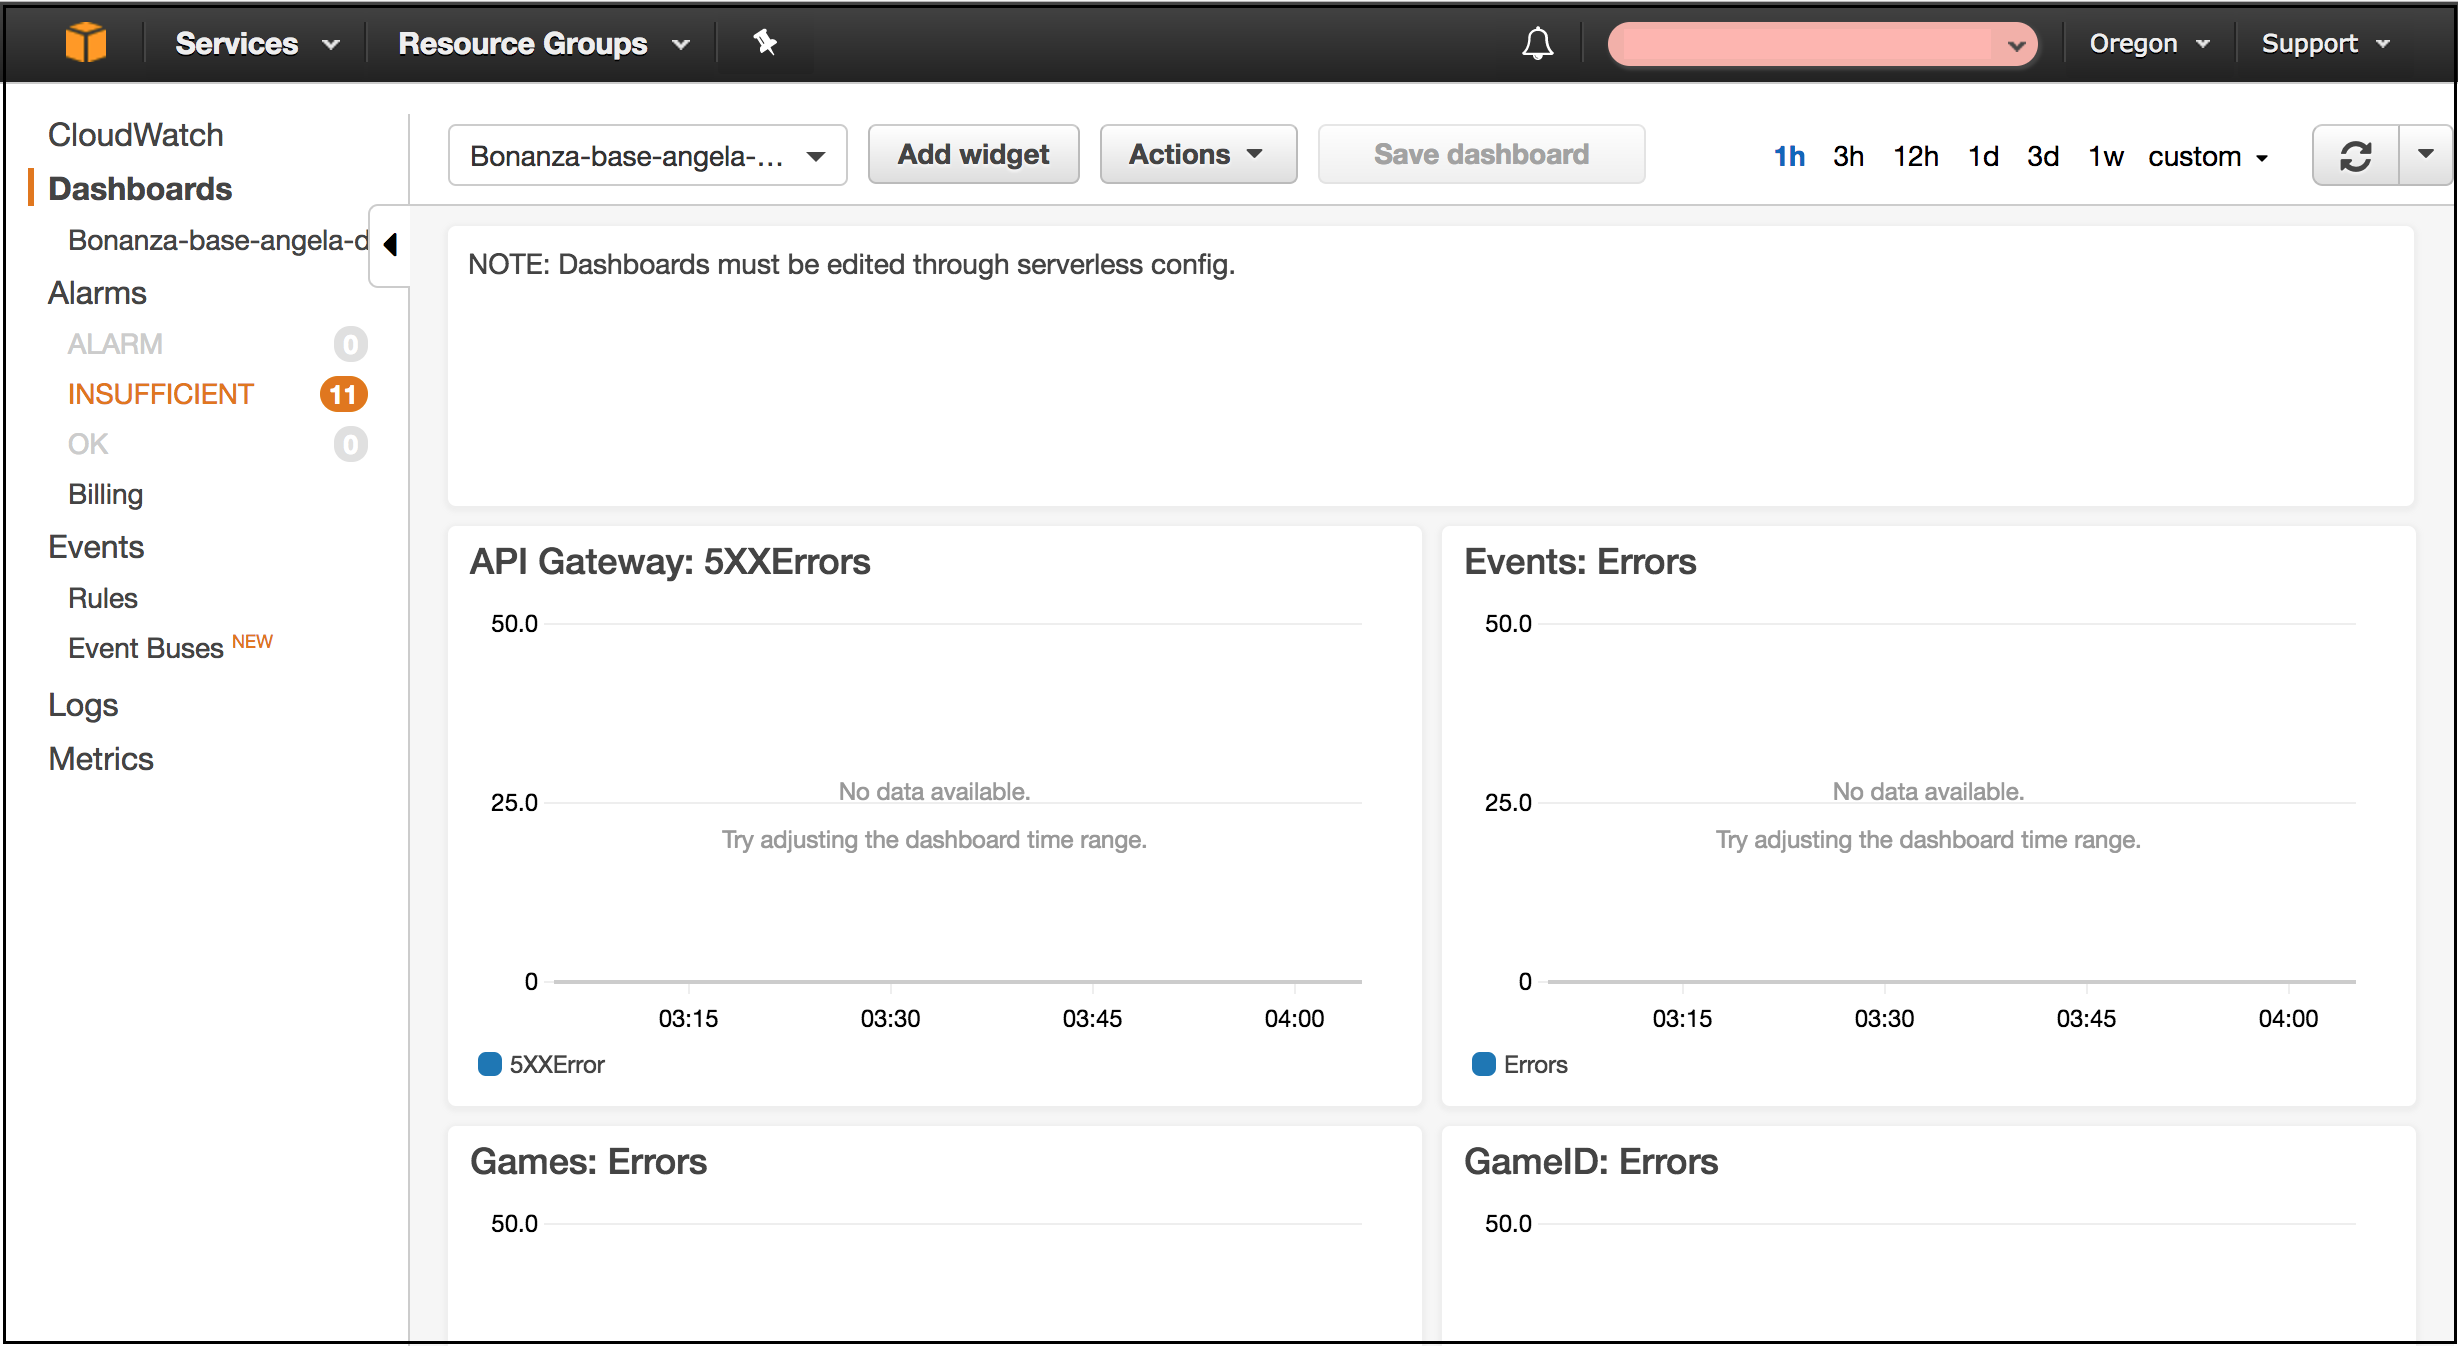
I left everything else as default. I chose a 12-column width for each metric widget because I wanted the dashboard to have two columns of widgets, to make it easier to skim the info in a single glance. After adding a text widget, and some tweaking to fix widget placement within the dashboard, this is what I ended up with as my config:
MetricsDashboard:
      Type: AWS::CloudWatch::Dashboard
      Properties:
        DashboardName: "Bonanza-${self:service}-${opt:stage}-dashboard"
        DashboardBody:
          '{
            "widgets":[
              {
                "Type":"text",
                // "x" is where (out of 24 columns) the widget will be placed.
                // 0 means the far left.
                "x":0,
                "y":0, // this places the widget at the top of the dashboard.
                "width":24,
                "height":3,
                "properties":{
                   // A nice note for other devs
                   "markdown":"NOTE: Dashboards must be edited through serverless config."
                }
              },
              {
                   "type":"metric",
                   "x":0,
                   "y":1,
                   "Width":12, // So this widget will take up half the dashboard width.
                   "height":6,
                   "properties":{
                      "metrics":[
                       [
                          "AWS/Lambda",
                          "Errors",
                          "FunctionName",
                          "${self:service}-${opt:stage}-events"
                       ]
                    ],
                    "period":60,
                    "stat":"Sum",
                    "region":"us-west-2",
                    "title":"Events: Errors",
                    "view":"timeSeries",
                    "yAxis":{
                      "left":{
                        "min":0,
                        "max":50
                    }
                  }
                 }
              },
              {
                 "type":"metric",
                 "X":12, // This widget will start at the halfway point of the dashboard width...
                 "y":1,
                 "width":12, // ...and take up half the dashboard (12/24 columns)
                 "height":6,
                 "properties":{
                    "metrics":[
                     [
                        "AWS/Lambda",
                        "Errors",
                        "FunctionName",
                        "${self:service}-${opt:stage}-games"
                     ]
                  ],
                  "period":60,
                  "stat":"Sum",
                  "region":"us-west-2",
                  "title":"Games: Errors",
                  "view":"timeSeries",
                  "yAxis":{
                    "left":{
                      "min":0,
                      "max":50
                  }
                }
               }
            },
            {
             "type":"metric",
             "x":0,
             // all metric widgets go under the text widget
             // so each metric widget has a "y" value of `1`
             // vs the text widget’s value of `0`.
             "y":1,
             "width":12,
             "height":6,
             "properties":{
                "metrics":[
                   [
                      "AWS/Lambda",
                      "Errors",
                      "FunctionName",
                      // We can deploy with different services and stages,
                      // so now the dashboard will display whatever service/stage was deployed
                      "${self:service}-${opt:stage}-searchteams"
                   ]
                ],
                  "period":60,
                  "stat":"Sum",
                  "region":"us-west-2",
                  "title":"Search Teams: Errors",
                  "view":"timeSeries",
                  "yAxis":{
                    "left":{
                      "min":0,
                      "max":50
                  }
                }
              }
            }
          ]
      }'
NOW I had a successfully deployed dashboard! If you’re interested in setting up a metric alarm in AWS, you can find the docs for that here; and if you want to set up a separate alarm in LogicMonitor, you can find the docs for that here and here. I honestly had just a ton of fun getting to figure this out - I hope my experience makes your configuration go a little more smoothly!
Have you worked with AWS or Serverless before? What cool stuff have you done - or what pitfalls have you found? Leave a comment and let me know!