Hierarchy of Metrics
[In a previous post, Mojtaba introduced us to the 5 categories of engineering metrics. These are appropriate for engineering teams. When combined with product and design, and looking at the organization and business as a whole, it’s important to distinguish between various levels of metrics.
Levels of Metrics
It’s important to distinguish between various levels of metrics, especially when looking at metrics at the highest level. The diagram below attempts to provide a hierarchy of metrics from the highest level of business metrics to the lowest level of engineering service metrics. It’s drawn as a pyramid to show the dependency (lagging-leading relationship), as well as the total number of metrics.
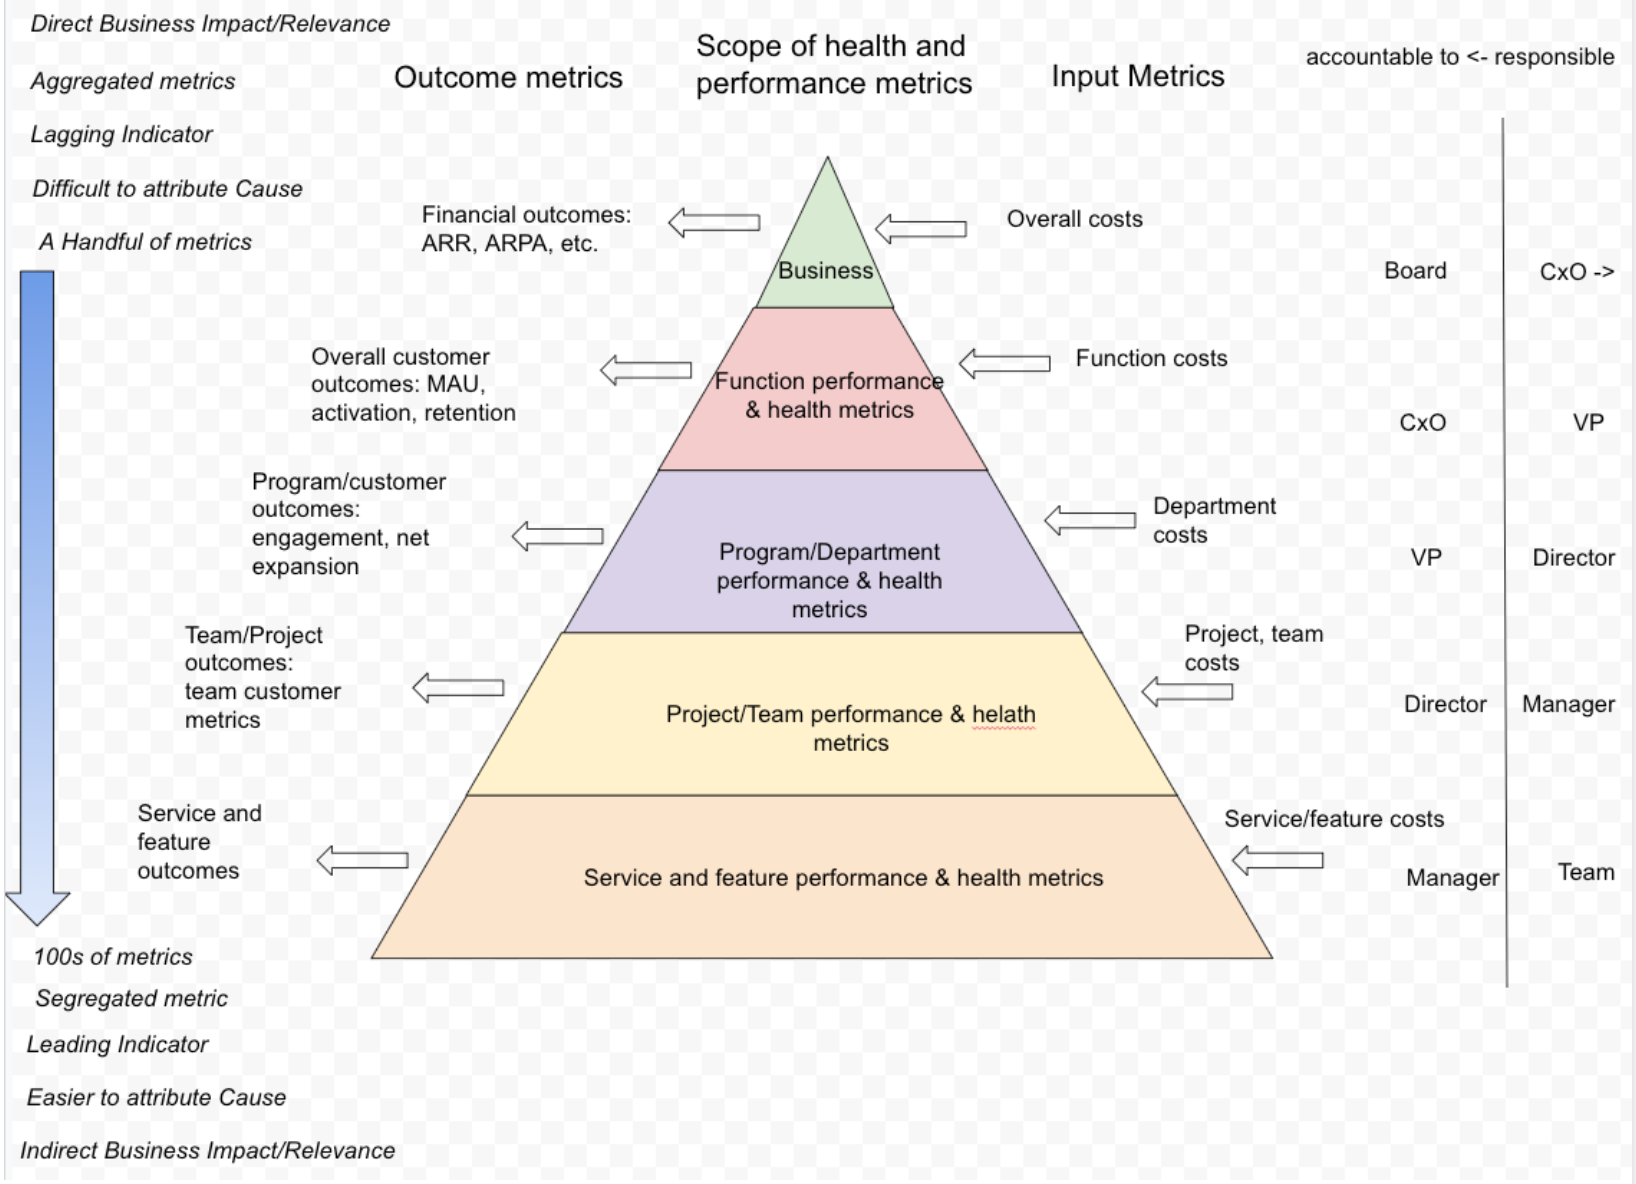
CxO Level (accountable to the board)
At the CxO level, a handful of financial metrics indicate the performance of the company as a function of input and outcomes. These have direct business implications but are lagging indicators and given that they are the result of aggregation and confluence of many factors, they are difficult to attribute directly to singular causes.
Examples of metrics at the CxO level:
| Input metrics | Outcome metrics | Performance metrics | Health metrics |
|---|---|---|---|
| OpEx and CapEx | ARR, revenue, profit | EBITDA, revenue per employee | Overall company engagement score, overall company retention |
At times, some high-level customer metrics are also used here since they are leading indicators of financial performance.
VP Level (accountable to CxO)
Typically, leading indicators of financial performance are customer metrics such as MAU, activation rates, churn, etc. Though these are leading indicators to financial metrics, they are themselves lagging indicators in relation to lower level metrics. Often some measures of financial metrics such as cost breakdown and budgeting are also relevant at this level. For Engineering (and Build), the input (cost) and output (customer value delivery cadence, significance and possibly quality) are also relevant metrics.
Examples of metrics at the VP level (for build and engineering):
| Input metrics | Outcome metrics | Performance metrics | Health metrics |
|---|---|---|---|
| Functional OpEx and CapEx; functional workload metrics | MAU, churn, activation rate | Overall cadence, significance and quality of delivery to customer (aggregated from programs/departments) | Functional engagement score, functional retention |
Director Level (accountable to VP)
At this level, specific programs or departments have their metrics that would impact customer metrics. These could be the cost of the program/department as well as value, cadence, and possibly quality of delivery to the customer (as a result of the program or as part of the department).
Examples of metrics at the Director level:
| Input metrics | Outcome metrics | Performance metrics | Health metrics |
|---|---|---|---|
| Department or Program OpEx and CapEx; department workload metrics | Program success metrics (which may be set at customer level, or even financial) | Cadence, significance, and quality of delivery to customer from program/department (aggregated from teams) | Department engagement score, department retention |
The cadence, significance and quality of delivery are leading indicators of higher level customer metrics, but are themselves lagging indicators of lower level metrics.
Manager Level (accountable to director)
At this level, metrics pertain to individual projects and teams.
Examples of metrics at the Manager level:
| Input metrics | Outcome metrics | Performance metrics | Health metrics |
|---|---|---|---|
| Team OpEx and CapEx; Team Workload metrics (% of effort per category of work) | Product Success Metrics (HEART metrics) | Team Performance metrics (DORA metrics, Velocity, Cycle Time) | Team engagement metrics (engagement, happiness) |
These metrics are often leading indicators to higher level program/department metrics but may be lagging indicators to lower level metrics (e.g. service metrics)
Team Level (accountable to manager)
The team uses a myriad of metrics to assess the services and systems it runs.
Examples of metrics at the Team level:
| Input metrics | Outcome metrics | Performance metrics | Health metrics |
|---|---|---|---|
| Service (and feature) costs (development and running); service load (traffic) | Service and feature delivery metrics: uptime, latency | Service metrics in relation to load and cost | Number of false alarms, true alarms |
[ Guest post from Mojtaba Hosseini ]